Auction rates & clearance rates throughout 2015
Posted date: January 11th 2016 . Author AdminSydney .
The Sydney residential market has once again made headlines, this time in regards to the falling auction clearance rates. In response to the reduction in rates, we’ve seen many news articles speculating the possibility of a bursting property bubble and a moderate growth outlook for 2016.
The auction clearance rate is a number that describes the weekly auction results. The rate is calculated by dividing the ‘sold at auction’ and ‘sold prior to auction’ results by all reported sales and ‘withdrawals’. In markets like Sydney where auctions are a favoured way of selling, the auction clearance rate is an indicator of the broader market’s performance.
The Sydney market has revealed a slowdown in the months leading into spring and towards the end of 2015. The trend of a declining auction clearance rate was particularly noticeable from May 2015. According to Australian Property Monitors (APM), the weekly auction clearance rates steadily fell from 89% at the beginning of May to 69.9% at the end of September and eventually ending the year at 61%.
The following graph shows the last recorded continuous decline in auction clearance rates occurred between March 2010 and December 2010, where clearance rates fell from 68% to 53%. It’s interesting to note that the rate of decline during 2010 was not as steep as what we observed from May to the end of 2015.
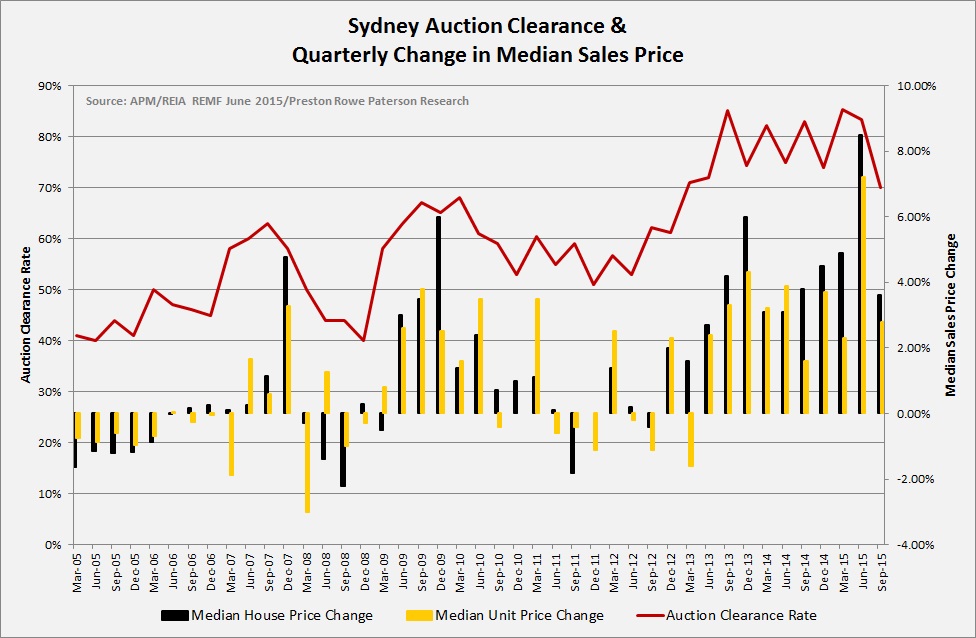
As illustrated in the graph, the Sydney house and unit median price growth slowed down in line with the trend of tightening auction clearance rates in the four months to September 2015. According to the latest figures from the Real Estate Institute of Australia, the house and unit median sales prices have increased by 3.6% and 2.8% respectively in the September quarter. Compared to the June quarterly growth of 8.5% for house and 7.2% for units, the September growth rates were relatively mild. The median auction sales price for Sydney properties plateaued in September stabilizing at a median price of approximately $1.110 million. This suggests that the Sydney market has passed its peak.
Despite a falling auction clearance rate since May, the market’s reaction to the clearance rates was met with an increase in listed weekend auctions towards the end of the year. Perhaps the speculation of a change in the market to a ‘buyer’s market’ caused vendors to chase high auction results in the waning market. APM has reported that in the first week of December 1,100 Sydney dwellings were listed for auction which resulted in a clearance rate of 57%.
When examining the decrease in clearance rates, it is noted that the rate is also affected by seasonal factors. As displayed in the above graph, the clearance rate and cialis discount vouchers median sales price are relatively slow during the June and December quarters when the majority of public holidays occur. A noticeable trend in the past decade reflects the March quarter recording the highest auction rate and median sales price growth. This trend was noticeable outside of the global financial crisis.
The September quarter was generally regarded as the ‘spring time growth’ period for median sales price and auction clearance. However, this could not be said for the September quarter 2015 where a quarterly change of -16% in auction results was recorded.
If the Sydney auction clearance rate continues to fall, the growth rate of median sales price for both house and units is expected to decline. Nonetheless there are areas within the Sydney market that contradict the downward auction and median sales growth trend, particularly in the suburbs that are located within close proximity to the Sydney CBD.
Please view the disclaimer on our website.