
GDP contracts for the first time in five years
Posted date: December 8th 2016 . Author AdminSydney .
Australia’s growth figures were released yesterday, with the revelation that the economy contracted by 0.5 per cent, in seasonally adjusted terms, over the September quarter. As a result, annual growth figures for the June quarter had also been revised down from the previous 3.1 per cent to 1.8 per cent. September’s figure is not only Australia’s first backward movement in twenty consecutive quarters but also transcended economists’ median forecasts of a smaller decline of around 0.2 per cent. Data suggests that slow wage growth and declining employment growth were a contributory factor to the decline in total demand. The household savings ratio for the September quarter jumped to 10.7 from 3.4 (June), which suggests that households are taking a more conservative approach towards their consumption patterns, which inevitably have led to the decrease in overall consumption for September. Notably, private dwelling investment for the quarter declined by 1.4 per cent, which suggests that Australia’s dependency on the housing market for economic growth has declined. Furthermore, we note that there has been a strong year-on-year decline in private business investment of 9.7 per cent, with both the mining and non-mining sectors underperforming over the twelve months to September. We do note that Australia’s terms of trade increased for the first time since December 2011, as the strengthening in commodity prices helped to buy ambien in canada increase the index to 1.2 per cent over the year (4.5 per cent over the quarter). The stronger commodity price have also reduced Australia’s current account deficit to $11.3 billion, the lowest in two years.
Whilst some have commented that this decline in growth over the quarter is an aberration, it will be interesting to see if we will have another GDP growth in the next quarter and ultimately see Australia entering a technical recession (i.e. two consecutive quarters of negative growth). We will be closely monitoring this impact of this recent negative growth on the economy and property markets moving into 2017.
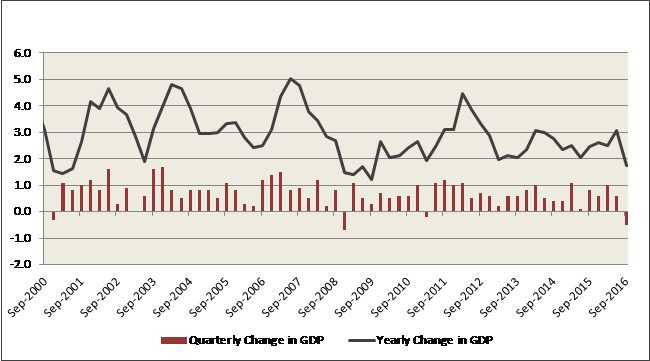
Figure 1: Quarterly and Yearly Change in GDP (Source: ABS)
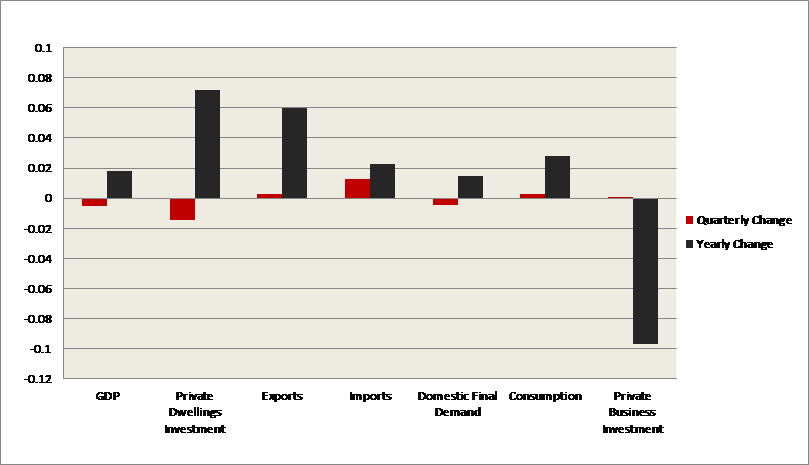
Figure 2: Quarterly and Yearly change in GDP components for September 2016 (Source: ABS)
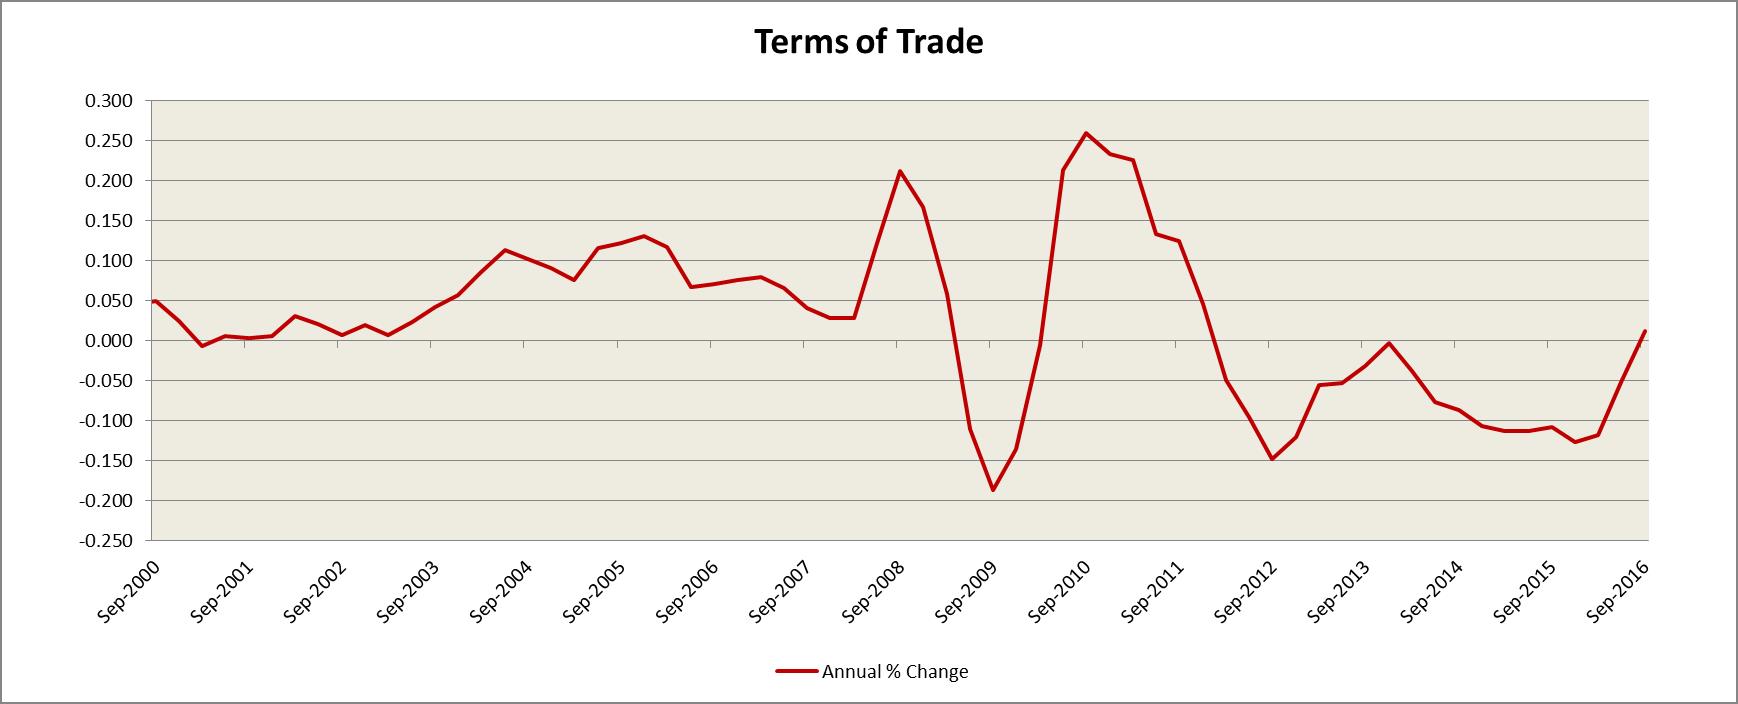
Figure 3: Annual change in Australia’s terms of trade (Source: ABS)