Sydney’s Dynamic Food Industry Outlook
Posted date: August 21st 2017 . Author Gregory Preston .
Sydney’s Dynamic Food Services Industry
The main drivers of the café, restaurant and takeaway food services industry include real household disposable income, convenience of service and location, health, competition and current trends in food culture. When we look at wage growth between 2004 and 2012, figures were around 4%, which allowed consumers to spend more on discretionary expenditure such as dining out. However, between 2012 and 2016, wage growth slowed to an average of 2% per annum, which inevitable would have an effect on consumers’ choice to do so. When we look at total turnover for café, restaurants and catering services in New South Wales, figures slumped down to $630.2 million during October 2014 before increasing to a turnover of $641.0 million in December 2014, and then further dropping to $626.9 million in February 2015. It was during February 2015 that turnover had recorded an annual decline of -1.95. However, we note that the sub-industry recovered afterwards, with fluctuating albeit positive annual growths up until January 2016, during which annual change in turnover in NSW peaked at 11.4% with a seasonally adjusted turnover of close to $710 million. As of May 2017, New South Wale’s Café, restaurant and catering services turnover stands at a seasonally adjusted $713.3 million, signifying a growth of 5.19% when compared to twelve months prior.
During this modern era, Australians are living busier lives, which inevitably would lead to an increased demand in fast and convenient food and beverages. According to the Australian Bureau of Statistics, takeaway food services have increasingly become a larger portion of total Food services turnover over the past three years. Back in September 2014, Café, restaurant & catering services as a % of total food services turnover stood at 61.1%, whilst Takeaway food services took up 38.2%. As at May 2017, Café, restaurant & catering services declined to 55.8%, whilst Takeaway food serviced increased accordingly to 44.2%.
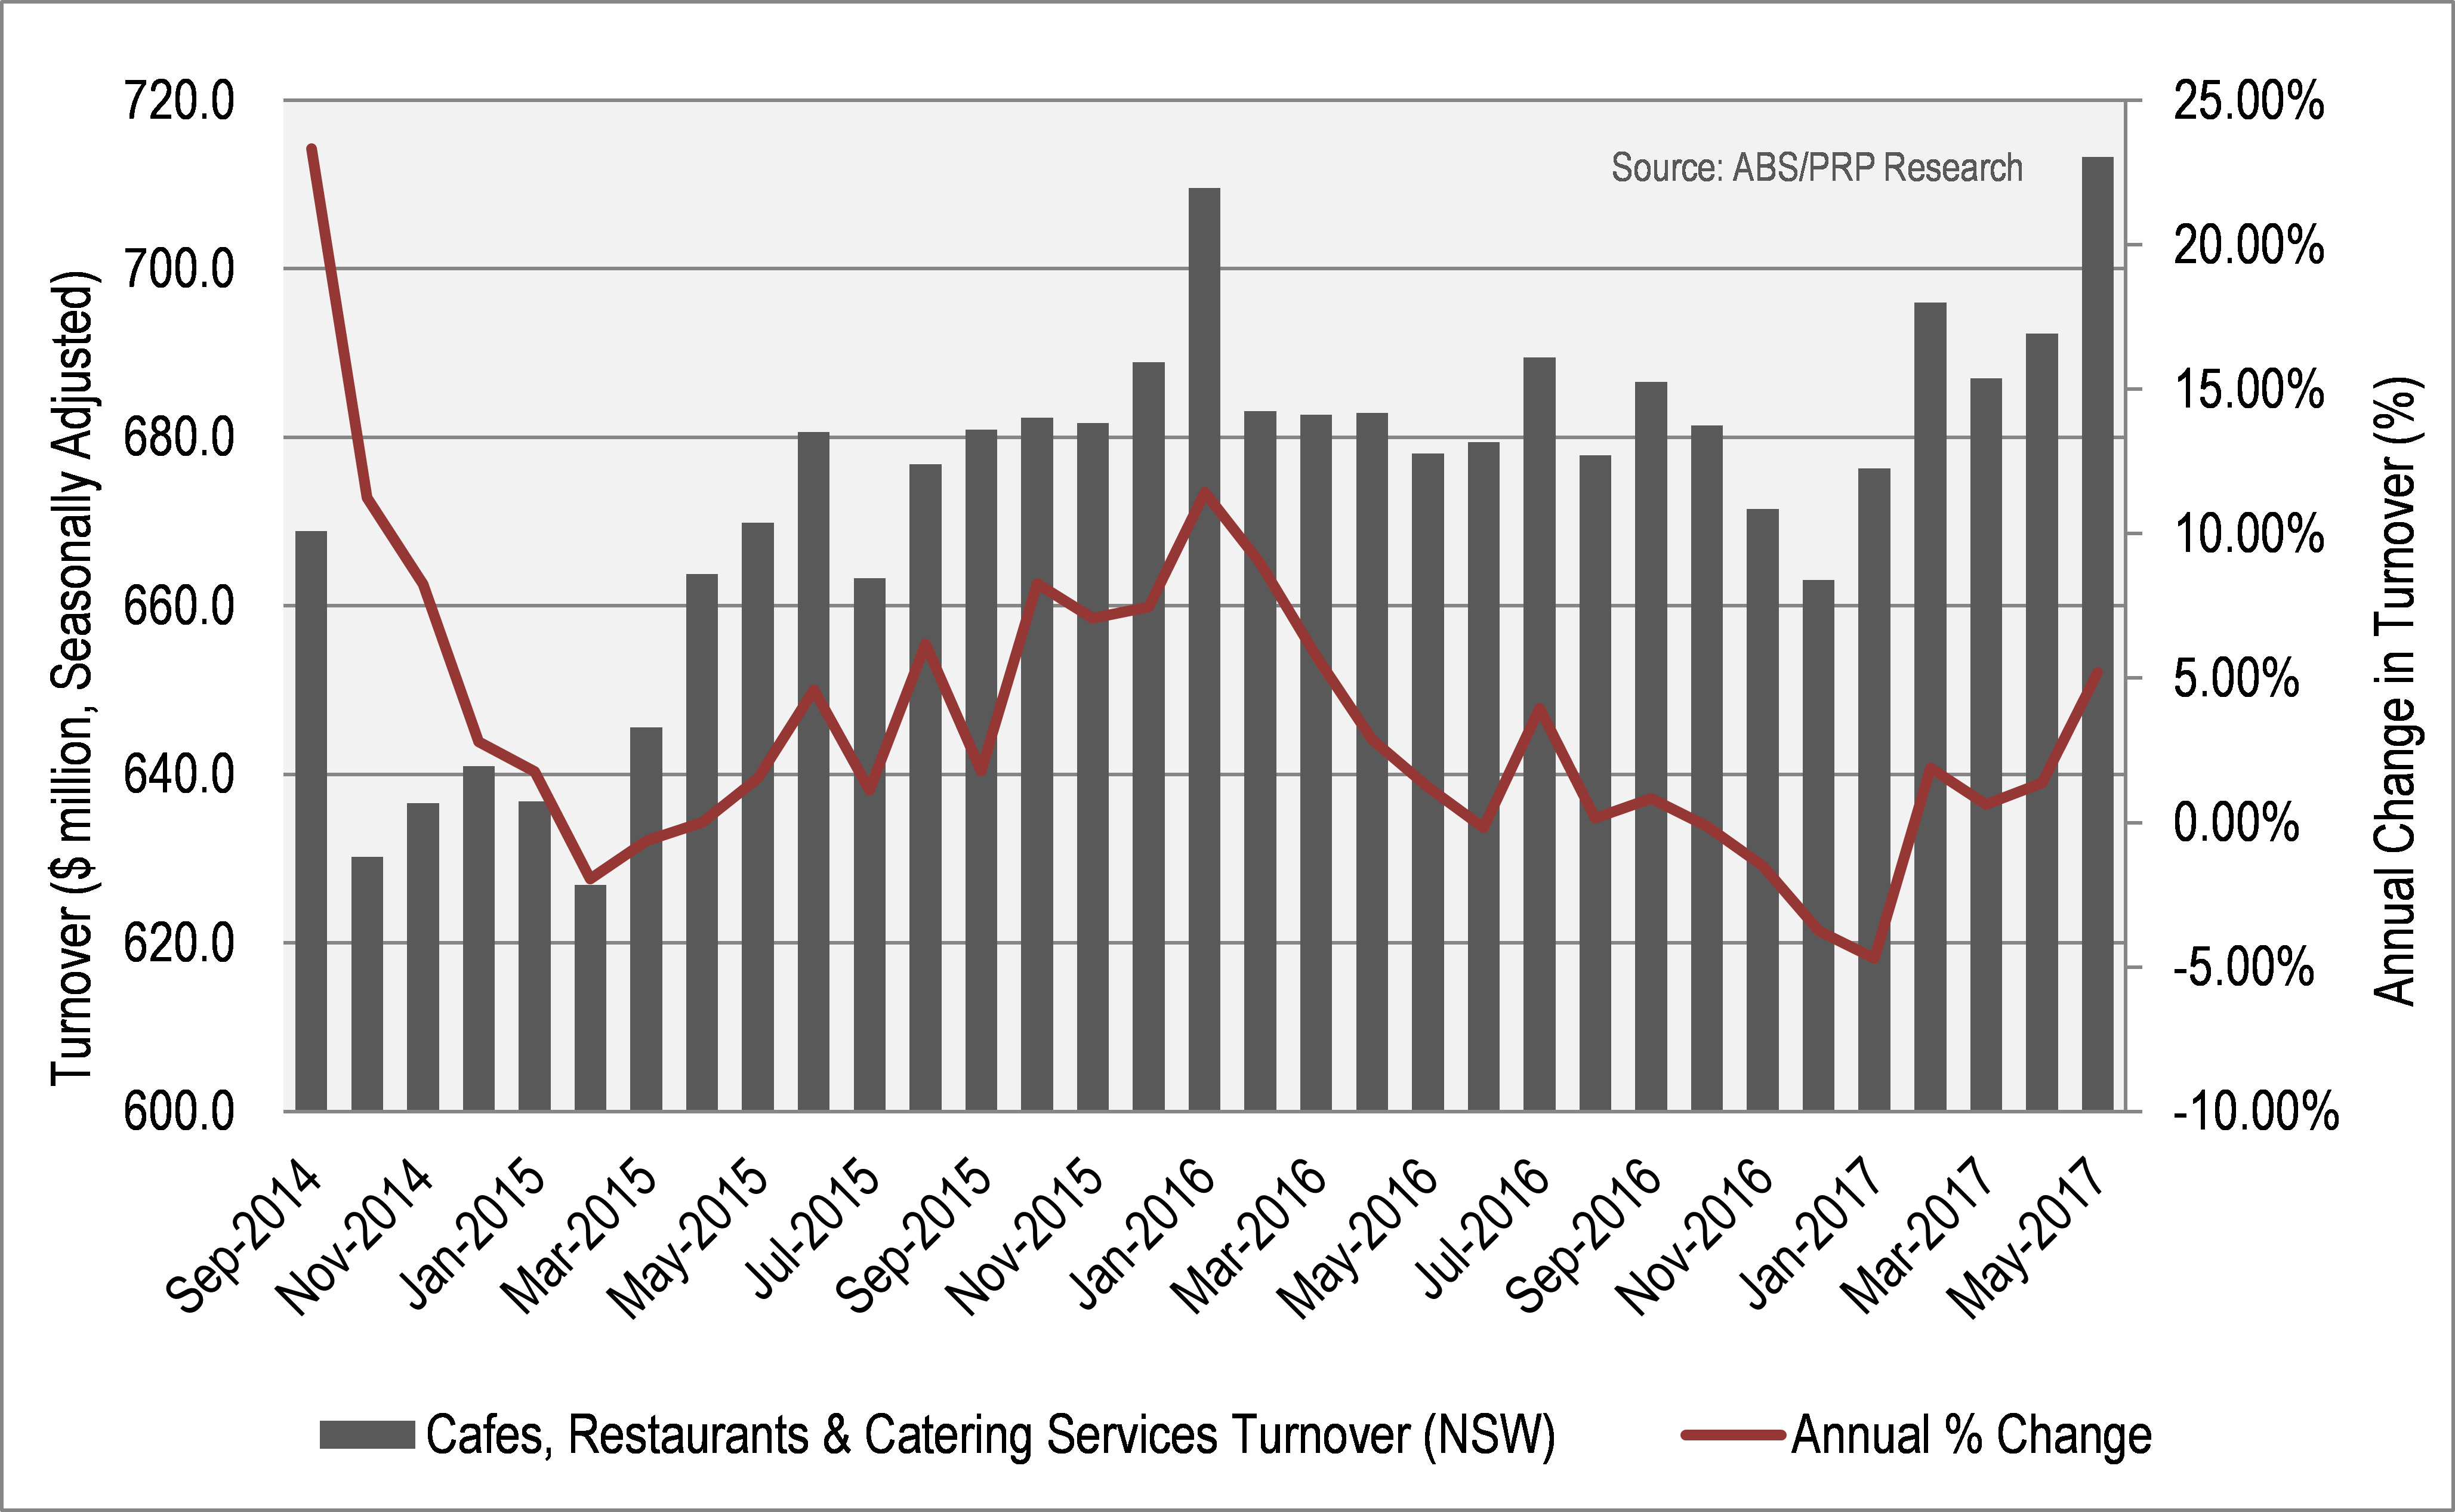
Chart 1- Monthly turnover and annual percentage change for Cafes, restaurants & catering services in New South Wales—Source: ABS
Consumer taste is also changing, with a shift in demand towards healthier, quality food and beverages. Restaurants have begun to focus on fresh, premium ingredients and increasing their menu range as this is expected to reap in the most customers as they search for better quality dining experiences. When we look at price growth of restaurant meals in Sydney, figures indicate that prices have been on the upward trend since December 2015 when it comes to restaurant meals, albeit it showing signs of strong price fluctuations prior. Similarly with price changes for Takeaway and fast foods in Sydney, we can see clear price fluctuations, with percentage increases peaking in December 2015 at 1.4% over the quarter (corresponding to Restaurant meals’ quarterly price decline of -0.4%), though figures indicate that price changes for takeaway & fast food appear to be on the downward trend. This figure indicate that in Sydney, consumers are becoming more inclined to spend more on quality produce which often comes with sit-in restaurants rather than takeaway and fast food chains. In saying this, competition within the restaurant and food services industry is strong, buy ambien mastercard which will be the main factor in limiting price growth in the future. From Figure 3, we can see that price changes in restaurants meals as well as takeaway food is gradually syncing with price changes in CPI, indicating that restaurants and takeaway food services will have less room to move when it comes to adding a mark-up to inflation. As at June 2017, restaurant meals in Sydney inflated by 1.0% when compared to the previous three months, whilst takeaway % fast food experienced a similar change with 0.9% inflation over the same period. However, Sydney experienced an overall increase in CPI of 0.4% over the June quarter, though this figure is influenced mainly by falls in domestic holiday travel & accommodation (-2.7%), insurance (-3.5%) and fruit (-4.5%).
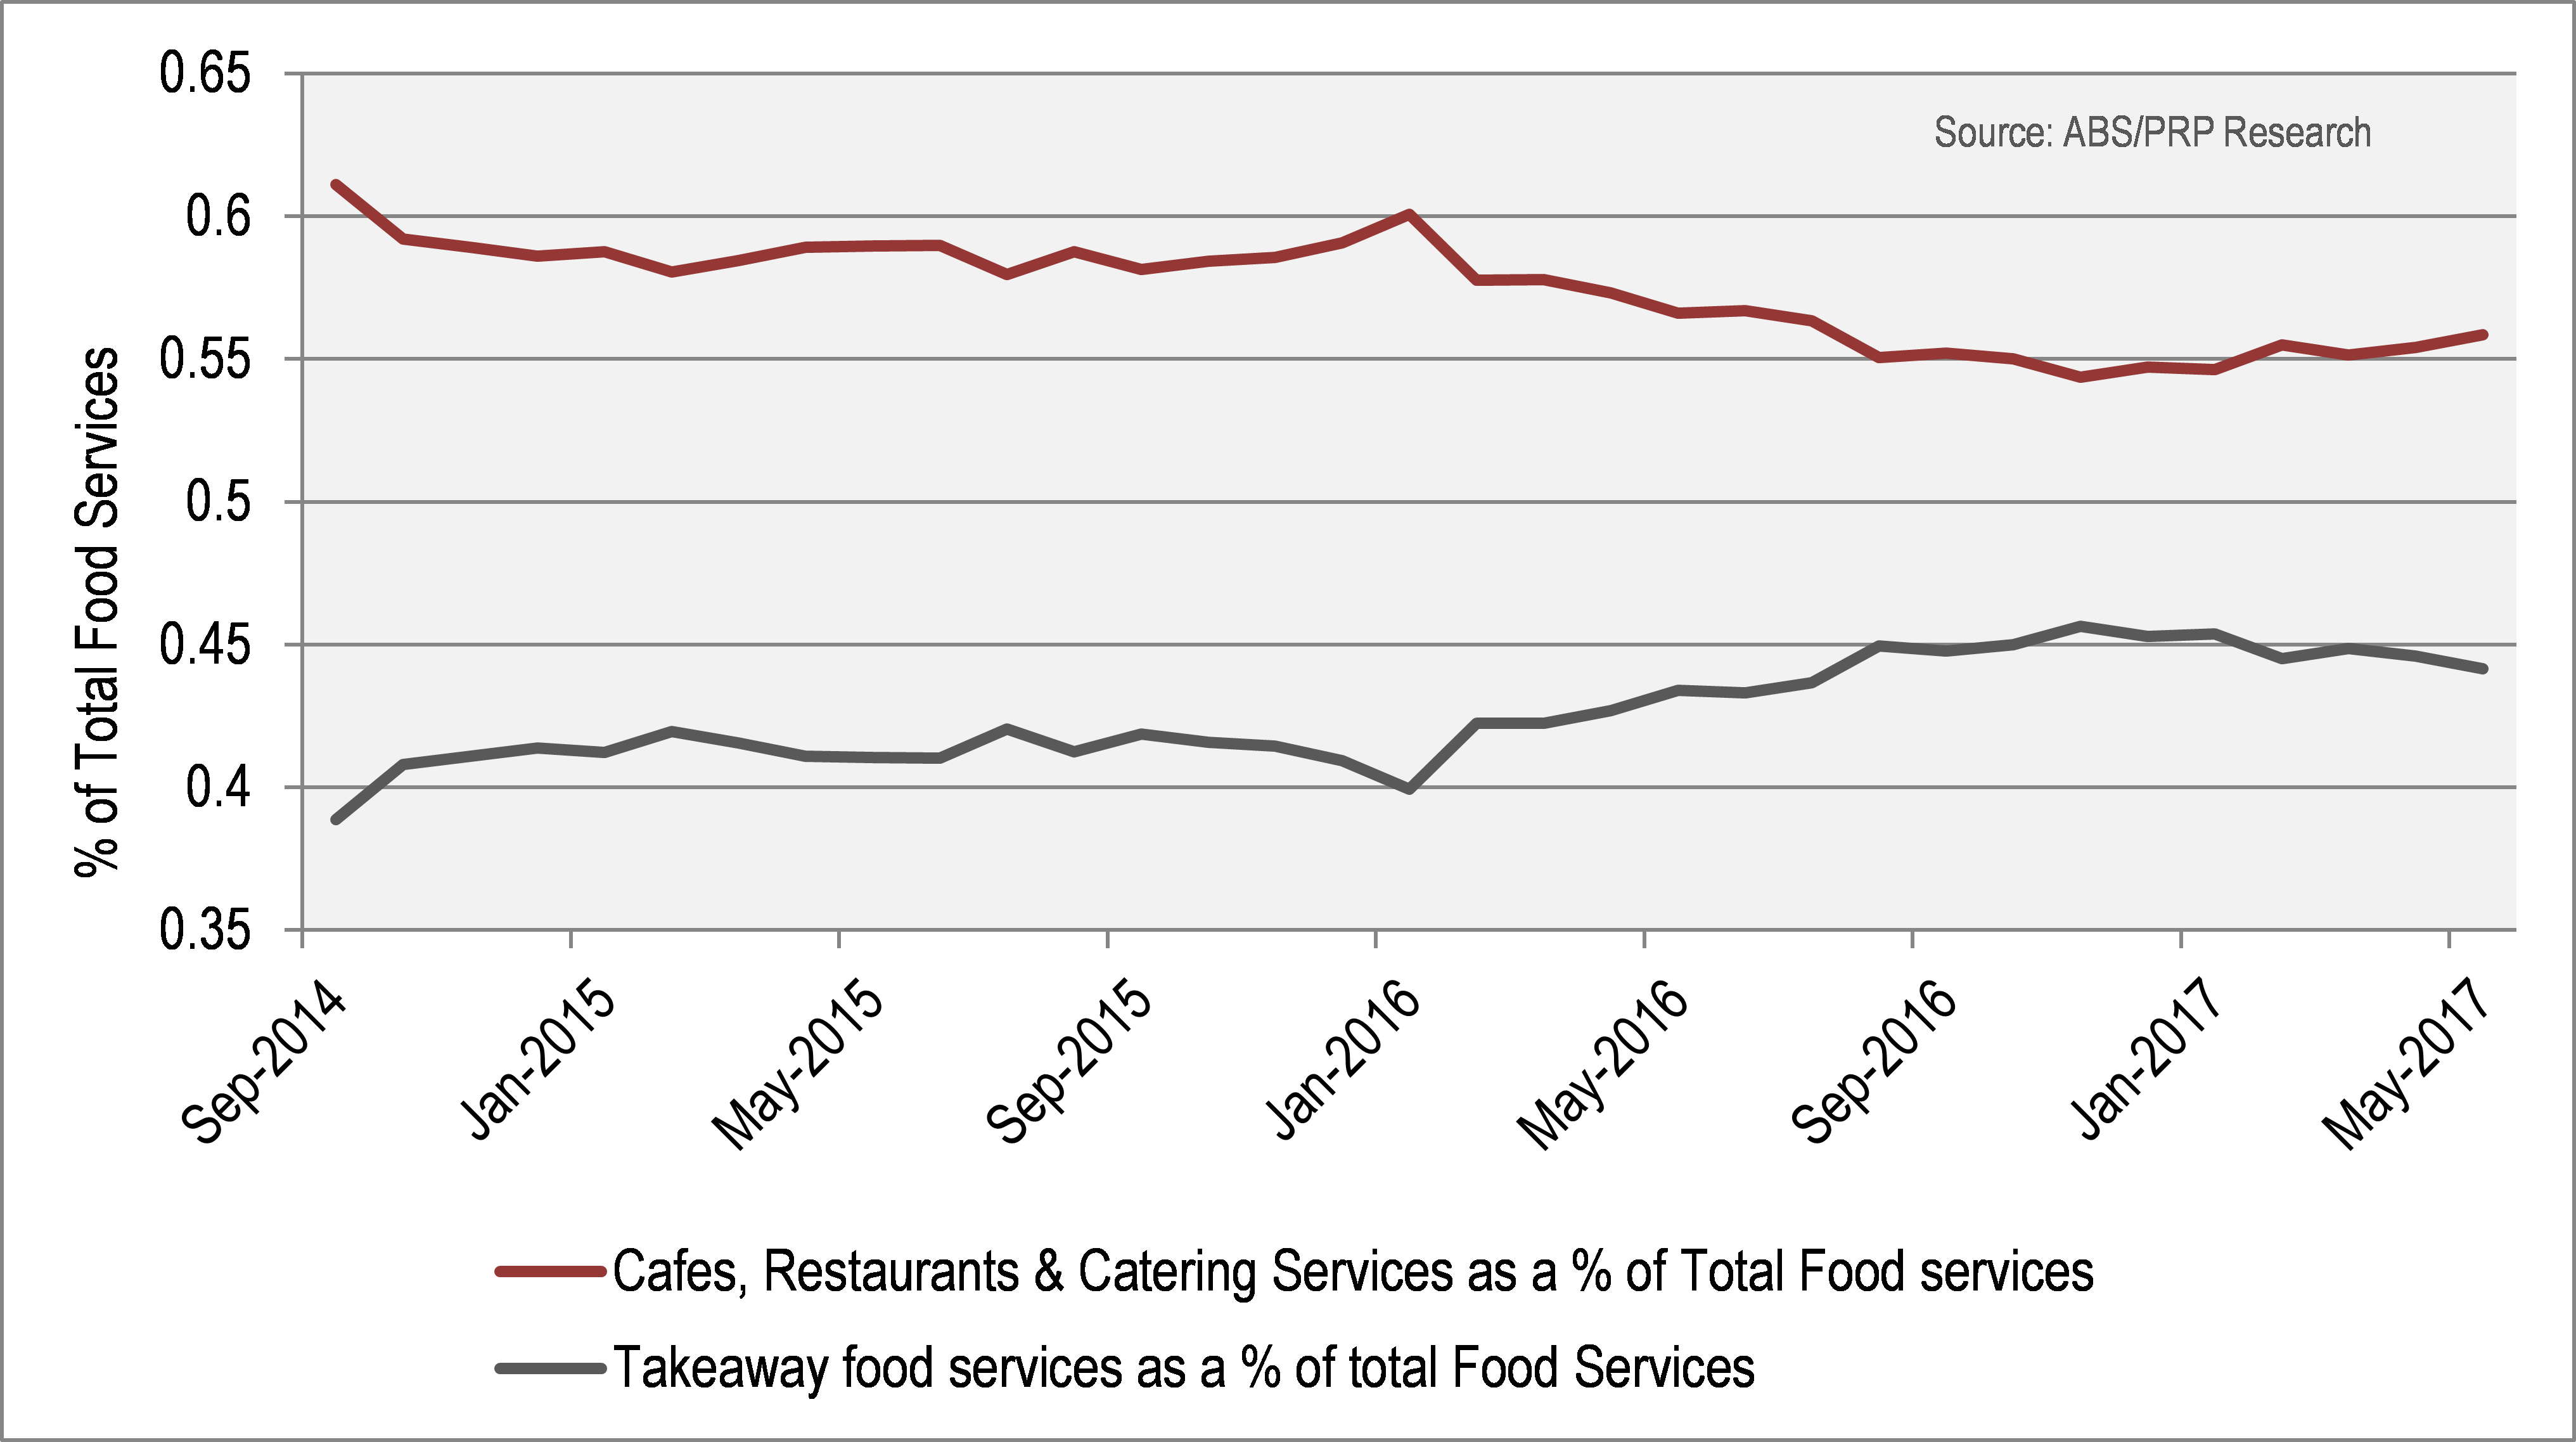
Chart 2- Food Industry subgroups as a percentage of total food services—Source: ABS