The risk-free rate – What does history tells us?
Posted date: July 24th 2015 . Author AdminSydney .
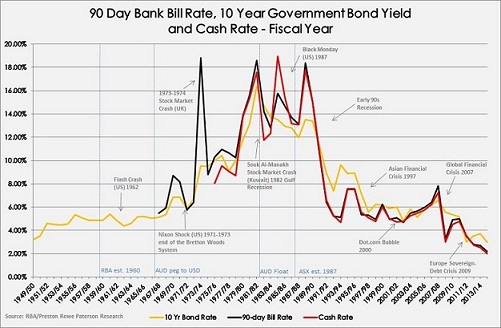
Interest rates are at historical lows as displayed in the chart below which considers the 10 year bond yield which is widely used and accepted as the risk-free rate.
As the risk-free rate is widely accepted as the foundation to discount rate models, entities wishing to invest are finding it difficult to adjust their capital investment hurdle rates downward in the current low interest rate environment because of the impact that the low risk-free rate has on traditional discount rate models. For example calculating the return to equity using capital asset pricing model (CAPM) and forecasting the return to a combination of debt and equity using the weighted average cost of capital (WACC) model.
Deriving discount rates from today’s risk-free rate will significantly lower the discount rates and increase value. The question arises as to how long rates will be at their present levels. Will market risk premiums need to increase to account for the possible likelihood of rates rising at some point in the future in the context of a CAPM calculation? Will debt costs in excess of the risk-free rate need to be carefully considered in a similar fashion?
This depends on how long rates will remain low at their present levels. On one view with the level of sovereign debt prevailing in some countries, can you buy generic cialis in canada it is difficult to see how rates could increase in the near term. Higher rates would be crippling at a time when countries such as Greece and its creditors are struggling to come in terms with the quantum debt let alone the cost of it.
Nonetheless some market participants are looking back through the history of risk-free rate to apply the long term mean or median to, what they say, appropriately adjusts for the probability that rates may at some point in the future rise.
The history in the chart below paints a telling story on short and long term interest rates in the context of the above discussion.

Much can be learnt from the chart including:
- When reviewing historical data for the last 60 years, there is no clear trend that follows after each major event.
- The average timespan for the economic boom and bust cycle is about 4.6 years over the spread of 60 years.
- The growth rate of each economic indicator varies between each global crisis.
- Historical data from the 1970’s and the 1980’s indicates a sharp rise and fall in interest and yield rates; reaching a 18.92% cash rate in the fiscal year end to 1984/85.
- Since the establishment of the ASX, the market recovery rate has slowed down.
- The fast rate of globalisation in the past 20 years has revealed that the average economic cycle is 3.8 years.
- In the past 10 years, the cycle has been reduced to 2.5 years.
- The most recent financial year ending to 2014/15 has revealed a historical 2% cash rate, 2.98% 10-year bond rate and 2.15% 90 day bank bill rate.
- We can observe that the 10-year bond has on average performed better than the cash rate in the past 20 years.
The mean and median risk-free rate can be viewed from the data over various time periods. The mean and median viewed respectively over 10 year time blocks are as follows:
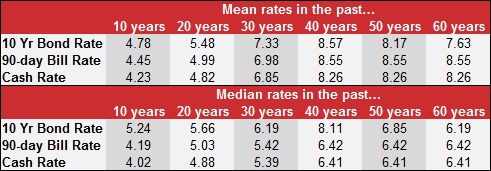
The hurdle rate (discount rate) setting for new acquisitions can be adjusted by looking not only at the market risk premium for CAPM or the cost of debt above the risk-free rate for WACC, but also by taking a historical time-based view of future risk-free rate from historical data to predict future rates in a risk adjusted sense.
As ever, market participants will view risk adjusted discount rates differently; the above discussion seeks to balance the application of the risk-free rate over the longer historical time series.