Sydney residential auction clearance rate disparity
Posted date: April 22nd 2016 . Author AdminSydney .
In the first quarter of 2016, the Sydney residential market has recovered from the low auction clearance results that occurred in the latter quarter of 2015; the lowest auction clearance rate recorded in early December 2015 was 57.5% and has now risen to 71% at the end of March 2016. However, the sign of recovery is not felt across all metropolitan regions. As illustrated in the graph below, only a selected number of regions have recovered.
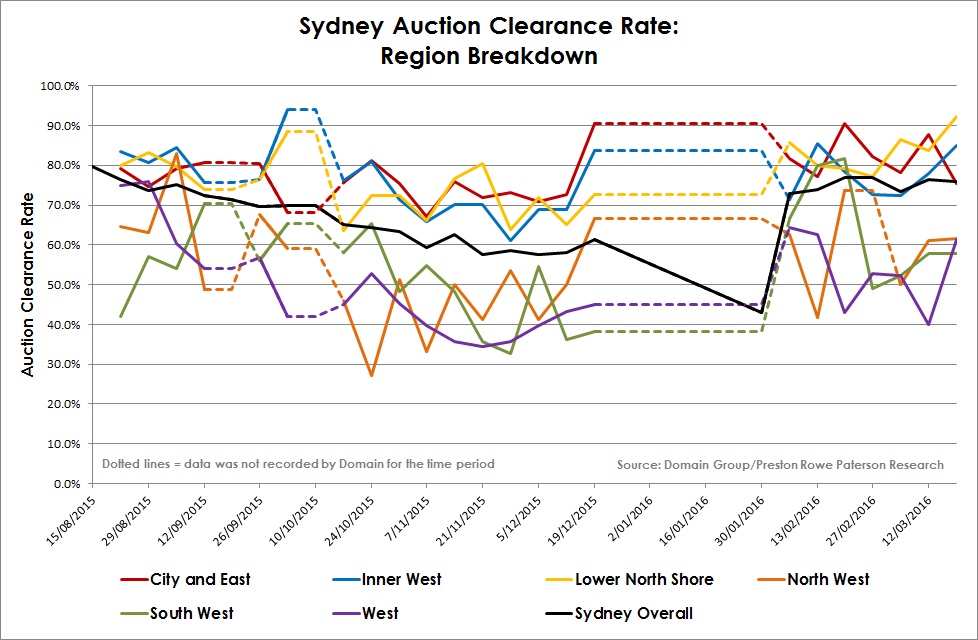
The Sydney residential market has become a two-paced market. The auction clearance rates remained high in the inner city regions particularly in suburbs within the Lower North Shore and the Northern Beaches regions, where the average auction clearance rate was 83% during the first quarter of 2016. Similarly the Inner West, Upper North Shore and the City and East regions recorded clearance rates above 75%. However, this did not apply to the regions in western Sydney as it struggled to perform. The West, South West and North West regions observed modest auction clearance rate of below 65% in the first quarter of 2016, where the West recorded the poorest clearance results with an average of 53.7%.
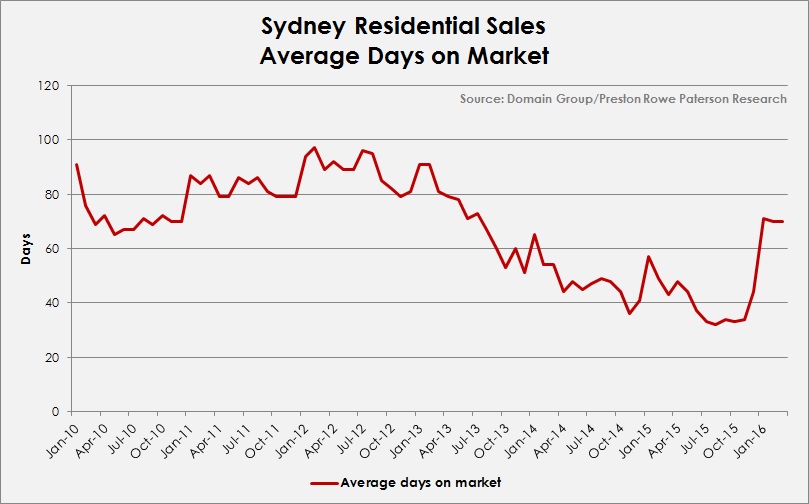
Although there are signs of a recovering market in the auction clearance rates, the overall Sydney residential listed sales’ average days on the market has increased significantly. Compared to the September 2015 average of 33 days, the March 2016 average days on the market has more than doubled to 70 days.
The Sydney Inner West and Upper North Shore regions revealed 35 days difference of average waiting days on the market for listed homes. The Sydney West region saw an increase of 44 days to 70 days on the market in the six months to March 2016.
Corresponding to the lowering auction clearance rates, the increase in average number of days on the market in the Sydney west regions shows that the residential market has declined which is the opposite to the well performing inner city and north shore regions.
Another factor that should be taken into consideration is that the number of residential properties listed for auction has declined since October 2015. During its peak, the number of properties in listed for weekly auctions in Sydney rose to 1,083. The majority of listed sales in that October weekend were located in the Inner West, Upper North Shore, City and East, and South regions. The trend of over 100 listed auctions in these regions followed through to early December. Despite attracting a high number of listed auctions in the last quarter of 2015, regions in the west and Canterbury and Bankstown recorded half as many as the inner city regions in early 2016. The number of listed auctions in these regions has since fallen significantly, corresponding to the falling demand for properties in these areas as reflected in the depressed clearance rates.
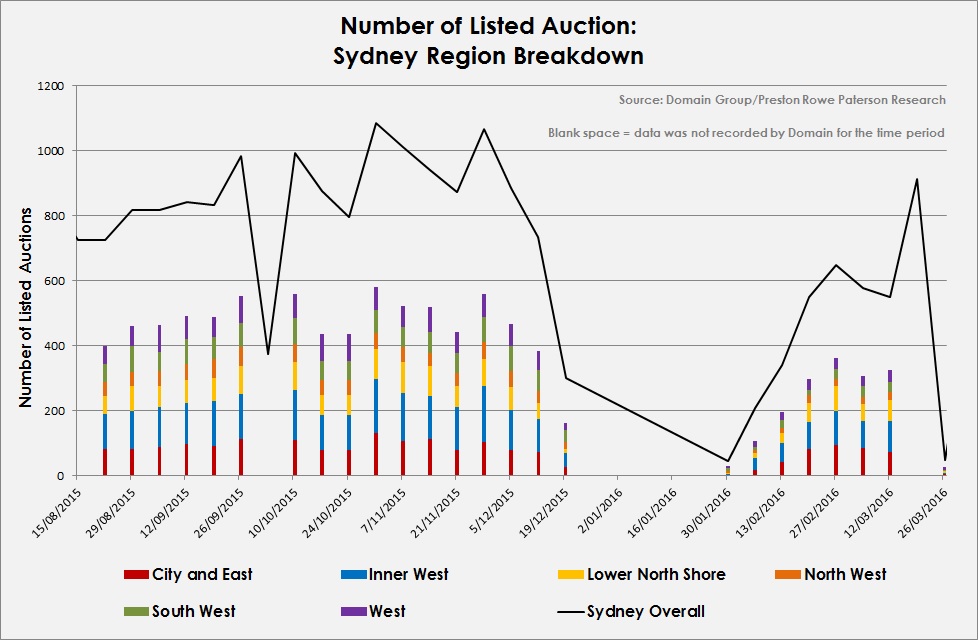
Taking into account of the number of successful auctions within each region, the amount of listed auctions and clearance rates, the disparity between the inner Sydney regions and buy cialis from canada online the western regions becomes clear. The region that has made a consistent ‘comeback’ is the Inner West and Upper North Shore region which remains in high demand whilst Sydney’s western regions struggle to perform.